Investigating data demographically is paramount due to the inherent diversity in payment channel preferences among individuals. Recognizing that not all customers are alike, it becomes imperative to tailor strategies accordingly. After all, why would one treat all customers identically when their preferences vary widely?
By delving into demographic data, businesses can gain insights into the unique needs and desires of different segments of their customer base. This enables them to offer customized experiences, ensuring that each customer feels valued and understood. Moreover, catering to a variety of preferences enhances the overall customer experience (CX), leading to higher customer satisfaction (CSAT) levels. Additionally, by understanding demographic nuances, businesses can implement strategies that encourage on-time payments, thus fostering stronger financial stability and customer loyalty in the long run.
In essence, investigating data demographically isn’t just about acknowledging diversity; it’s about optimizing outcomes and building lasting relationships with customers.
Payment Channel Preferences: By Region
Examining regional differences in payment preferences is crucial as consumer behaviors and preferences can vary significantly based on geographical location. Factors such as culture, infrastructure, and economic conditions can influence how individuals choose to make payments. For instance, urban areas might have higher adoption rates of digital payment methods due to greater access to technology and convenience, while rural areas might still rely heavily on traditional payment methods like cash or checks.
Understanding these regional nuances enables businesses to tailor their payment options to better suit the preferences and needs of customers in different areas, ultimately enhancing customer satisfaction and driving business success.
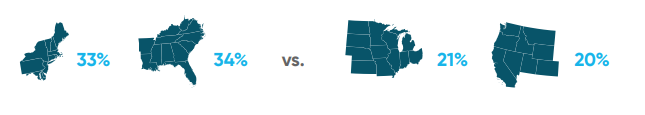
- Mailing a Check:
Variations in the preference for mailing checks across regions highlight the importance of considering regional differences in payment methods. In the Northeast and South, 33% and 34% of respondents, respectively, favored mailing checks, whereas in the Midwest and West, the figures were 21% and 20%, respectively. Survey respondents in the Northeast, South and Midwest were more likely than those in the West to pay a bill in person, by handing cash or a check to a person.
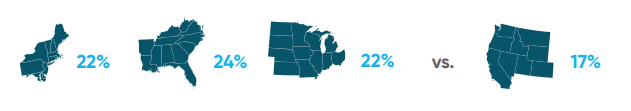
- In-Person:
In the South, 24% of respondents favored in-person payments, followed closely by the Northeast and Midwest at 22% each, while the West exhibited a slightly lower preference at 17%. Survey respondents in the South were more likely than those in the Northeast, Midwest, and West to pay a bill using a drop box location.
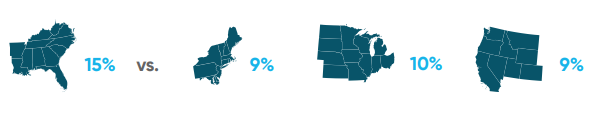
- Drop Box:
In the South, 15% of respondents preferred drop box payments, while in the Midwest, Northeast, and West, the figures were slightly lower, at 10%, 9%, and 9%, respectively.
Payment Channel Preferences: By Household Income
Examining household income is crucial when assessing payment preferences as it offers vital insights into individuals’ financial capabilities and priorities. Payment preferences can vary significantly depending on income levels, with higher-income households often preferring convenient and efficient payment methods, while lower-income households may prioritize affordability and flexibility.
Understanding these nuances allows businesses to tailor their payment options to better suit the diverse financial situations of their customers. Moreover, considering household income enables businesses to implement inclusive and equitable payment strategies that cater to a wider range of customers, thereby fostering customer satisfaction and loyalty. By acknowledging the importance of household income in payment preferences, businesses can better address the diverse needs of their customer base and enhance overall financial well-being.
Survey participants with household incomes ranging from $50k-$99.9k and those earning $100k or above were both notably more inclined to utilize various bill payment methods compared to respondents earning less than $50k. These methods included utilizing online portals provided by their biller or bank, as well as mailing a physical check for bill payment.
- Online Portal Supplied by Biller:
Among respondents earning over $100k annually, 64% preferred using an online portal provided by their biller for bill payment, followed closely by those in the $50k-$99.9k income bracket at 57%, and respondents with household incomes below $50k at 43%. - Online Portal Supplied by Bank:
For online portals supplied by their bank, 58% of respondents with household incomes exceeding $100k favored this method, followed by 47% of those earning $50k-$99.9k, and only 27% of respondents with incomes below $50k. - Mailing a check:
When it comes to mailing a physical check for bill payment, 34% of respondents earning over $100k annually preferred this method, while 30% of those in the $50k-$99.9k income range opted for it. In contrast, only 17% of respondents with household incomes below $50k chose to mail a check. - AutoPay:
Automatic payments aren’t universally embraced, as some individuals may not feel assured that they’ll consistently have sufficient funds in their account to cover AutoPay obligations. With that in mind, 21% of respondents with household incomes exceeding $100k preferred this method, while 15% of those earning less than $50k and those in the $50k-$99.9k income bracket favored it. - Paying by Phone, Speaking with an Automated System:
Survey respondents with a household income of less than $50k (29%), and those with a household income between $50k-$99.9k (29%), were both more likely than those with a household income of $100k or more (21%) to pay a bill by phone, speaking with an automated system.
Payment Channel Preferences: By Age
Examining age demographics in payment preferences is crucial as different age groups exhibit distinct financial habits and technological comfort levels. Younger generations often favor digital payment methods, while older generations may prefer traditional methods like cash or checks. Tailoring payment solutions to age-related preferences ensures businesses meet the diverse needs of customers and stay relevant in an evolving market. By acknowledging age as a significant factor in payment preferences, businesses can enhance customer satisfaction and loyalty across all generations.
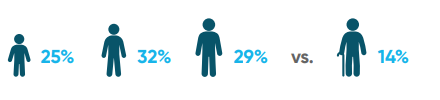
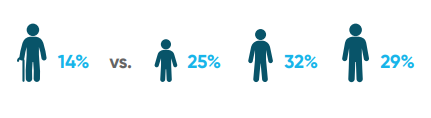
- Mobile Device:
Millennials and Gen X show higher preferences for mobile payments, with 32% and 29%, respectively, while Gen Z follows closely at 25%. In contrast, Baby Boomers exhibit a lower preference at 14%.
- Online Portal Supplied by Bank:
Millennials and Gen X demonstrate a stronger inclination towards online banking portals, representing 32% and 29% respectively, while Gen Z closely follows at 25%. On the other hand, Baby Boomers show a lower participation rate, accounting for only 14% of online portal users.
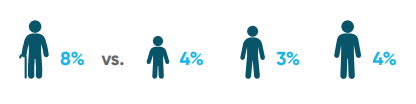
- Mail a Check:
When it comes to mailing in a physical check, Baby Boomers show the highest inclination at 8%, while, unsurprisingly, both Gen Z and Gen X display a lower preference at 4%. Millennials, on the other hand, demonstrate the lowest engagement, representing only 3% of check mailers.
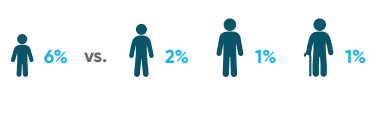
- Text Message/SMS:
There’s a notable discrepancy in the use of text messages/SMS for payments among different generations. Gen Z leads with 6%, while Millennials follow with 2%. Gen X and Baby Boomers both indicate a lower engagement, each representing only 1% of text message/SMS payment users.
Billing organizations should carefully consider these the diverse payment preferences observed across different demographic groups, to not only enhance customer satisfaction but also foster greater engagement and loyalty. Understanding and accommodating diverse payment preferences can contribute to improved operational efficiency and financial stability, enabling billing organizations to ultimately drive long-term success in an increasingly competitive landscape.
Download our 2024 State of Online Payments report for a full update on today’s billing and payment preferences.